What is the correct metric to measure a player’s offensive contribution in a football game? Is it goals, assists, expected goals, expected assists? While we may never find a perfect answer to the question, one metric comes close. Expected Threats (xT) works on a simple but effective thought process. For example, if a player has a ball at his feet in a specific part of the pitch, what is the likelihood that the ball may end up in the back of the net after some moves. This is what xT aims to do.
Under the metric, the aim is to sense the action just before a key pass, a brilliant through ball to see a pattern. This helps in identifying players who are the chief creators of the team. The xT model is an improvement on the previously xG chain model, which had limitations. In the previous model, the same value was assigned to every player in the move before the assist. However, it didn’t distinguish between the quality of the passes and the vision of a player who did the most challenging job while creating the goal. So, it would be hard to identify the real creative genius.
So, how does the xT model work?
What is Expected Threat (xT)?
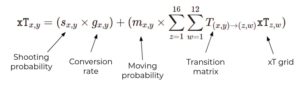
Well, first, we must get the math out of the way. The formula for deriving xT was developed by Karun Singh in his blog in 2018. He divided the entire football pitch into grids. In football, after getting a ball, a player has two options, either shoot or move the ball into a different grid through passing or carries.
So Karun Singh calculated the shooting probability and moving probability from each grid. So, for example, a grid inside the Penalty box will have a high shooting probability compared to, say, the middle of the pitch.
Using this methodology, he first calculated the number of times a player shot from a grid and multiplied it by the goal conversion rate from that grid. Then he figured how often a player would move or pass the ball to a different grid. The second value was called the transition matrix. So, when you multiply the shooting probability by the conversion rate, add it to the moving likelihood, which has been multiplied with the transition matrix and xT grid.
This led to the creation of the xT formula, which is as follows:
Source: Soccerment
This gives us the most accurate ratings for a player’s offensive contributions. The xT metric has been further divided into two parts, xT from passes and xT from carries.
Gather around fellas. Manchester United have finally signed a good centre back
The…
Click Here to Read the Full Original Article at FootTheBall…